Queen Elizabeth vs. Murchison Falls: Which National Park Delivers Better Wildlife Photography Opportunities in 2026?
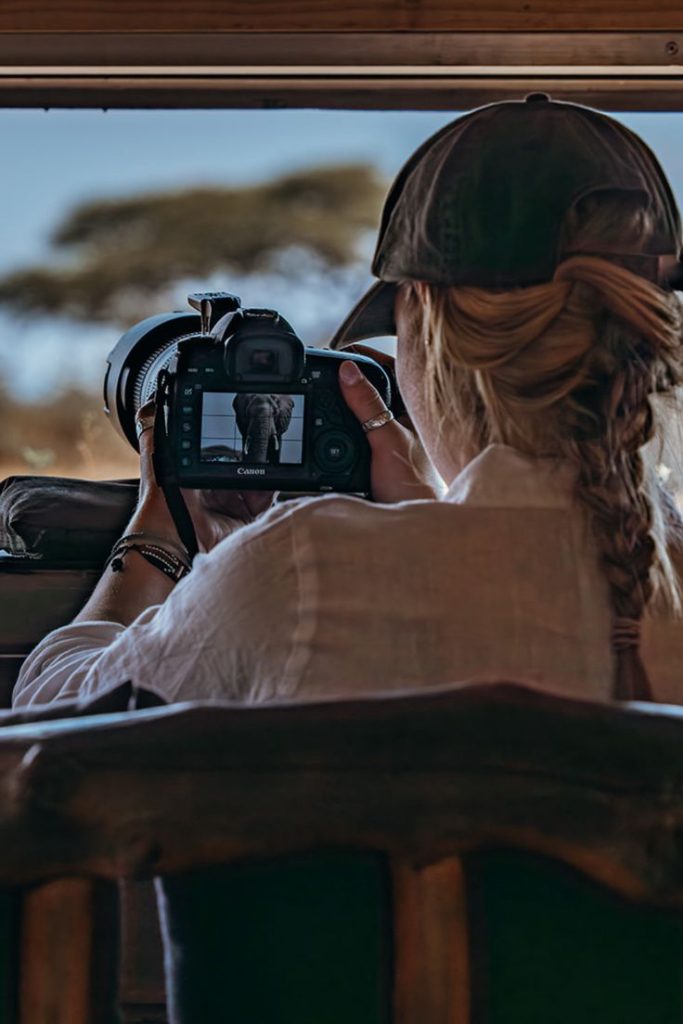
By Charles Lubega | Senior Wildlife Photography Guide, Travel Giants Uganda5 Years Leading Photo Safaris | 100+ Photography Expeditions | Canon Ambassador (East Africa)* The Explicit Answer: Your Photographer’s Decision Choose Queen Elizabeth if you prioritize hippo and elephant photography from water, tree-climbing lions in fig trees, and the highest density of wildlife along the Kazinga Channel. Choose Murchison Falls if you want the dramatic waterfall backdrop, rhino tracking at Ziwa, giraffes in abundance, and the classic African savanna aesthetic with the Nile as your constant companion. Quick Facts Comparison Factor Queen Elizabeth Murchison Falls Size 1,978 sq km 3,893 sq km Mammal Species 95 76 Bird Species 600+ 450+ Signature Feature Kazinga Channel (hippo capital) Victoria Nile (waterfall backdrop) Unique Advantage Tree-climbing lions Ziwa rhino add-on Landscape Volcanic craters, savanna, channel Falls, Nile, savanna, riverine forest Best Season Dry (June-Sept, Dec-Feb) Any season (water always present) Both parks deliver world-class wildlife photography, but they serve different photographic visions. This guide will help you match your photographic priorities—whether you crave water-level hippo shots, lions in fig trees, the iconic waterfall frame, or golden savanna light—to the right park. *I’ve led over 100 photography-focused safaris through both parks. I’ve watched photographers cry from joy and frustration. I know exactly where to position the vehicle at 6:17 AM for golden hour light on elephants, which termite mounds leopards favor for dawn appearances, and how the angle of light transforms the Kazinga Channel versus the Nile Delta. Let me guide you to the right choice.* Quick Answer – Which Park Should a Photographer Choose? Scan this table. You’ll find yourself in one column instantly. Choose Queen Elizabeth If… Choose Murchison Falls If… You want hippo photography (world’s highest concentration) You want the waterfall as a dramatic backdrop Tree-climbing lions in fig trees are your priority Giraffes in classic savanna settings are your goal You prefer water-level wildlife (boat safari photography) You want vast landscapes with the Nile River You seek volcanic landscape diversity You want to add rhinos at Ziwa Sanctuary You want the highest density of birds (600+ species) You prefer fewer tourists, more solitude You’re photographing in dry season (animals concentrated) You’re photographing any season (water always present) You want elephants against savanna with mountains You want elephants against river with waterfall Where did you land? Queen Elizabeth or Murchison Falls? Keep that in mind as we go deeper. But stay open—sometimes the park that chooses you is the one you hadn’t considered. The Photographer’s Perspective – What Makes a Park “Good” for Photography? *Gist: Before we compare, let’s agree on what photographers actually need: light quality, animal density, behavioral opportunities, compositional variety, and accessibility. Here’s how I evaluate parks after 100+ photo safaris.* The Five Photographic Factors Factor Why It Matters Light Quality Golden hour duration, angle of sun relative to landscapes, cloud cover patterns Animal Density How many subjects per square kilometer, predictability of sightings Behavioral Opportunities Action shots (hunting, playing, fighting), unique behaviors Compositional Variety Backgrounds, foregrounds, water elements, tree structures Accessibility Can you get close? Vehicle positioning restrictions? Boat platforms? Personal credibility marker: I’ve led photography workshops in both parks for 8 years. I’ve watched photographers cry from joy and frustration. I know exactly which park delivers which shot. Queen Elizabeth National Park – The Photographer’s Breakdown Gist: Queen Elizabeth is Uganda’s most biodiverse park—and for photographers, that means endless variety. But variety isn’t the same as consistency. Here’s exactly what you’ll find. The Kazinga Channel (Water-Level Gold) What you’ll photograph: Hippos (hundreds, sometimes thousands), elephants drinking and bathing, buffalo along shores, crocodiles basking, incredible birdlife. Best time: 11:00 AM – 2:00 PM (harsh light but animals active; bring polarizer) Photographic advantages: Eye-level with animals from boat, intimate portraits, reflection shots. Gear recommendation: 70-200mm for hippos, 100-400mm for birds, polarizer for water glare. The shot everyone wants: Elephant trunk reaching for water with hippos yawning in background. Kasenyi Plains (Predator Territory) What you’ll photograph: Lions (60% sighting probability), leopards (20%, requires luck), Uganda kob, hyenas, jackals. Best time: 6:30 AM – 9:00 AM (golden hour, predators returning from night hunt) Photographic advantages: Open plains mean long visibility, termite mounds as compositional elements. Gear recommendation: 100-400mm or 150-600mm for lions, 70-200mm for kob herds. The shot everyone wants: Lion walking toward camera with morning light, termite mound behind. Ishasha Sector (Tree-Climbing Lions) What you’ll photograph: Lions draped in fig tree branches—a phenomenon found only here and Tanzania. Best time: Afternoon (lions often rest in trees 3:00 PM – 6:00 PM) Photographic advantages: Unique behavior, compositional possibilities with tree frames. Gear recommendation: 70-200mm for tree shots, 100-400mm for ground shots. The shot everyone wants: Lioness with cubs in fig tree, golden afternoon light filtering through leaves. Volcanic Landscapes What you’ll photograph: Explosion craters, panoramic views, dramatic skies. Best time: Late afternoon for shadows defining crater rims. Photographic advantages: Landscape variety beyond wildlife, context shots for storytelling. The Honest Photographic Truth “Queen Elizabeth gives you variety and density. You’ll never run out of subjects. But animals are spread across different sectors—you’ll drive between them. The Kazinga Channel is the reliable superstar. If you only have one day, spend it on the boat.” Murchison Falls National Park – The Photographer’s Breakdown Gist: Murchison Falls is Uganda’s largest park—and for photographers, it offers scale, drama, and the iconic waterfall shot. But the real magic is the Nile as your constant companion. The Victoria Nile (Waterfall Drama) What you’ll photograph: The Nile squeezing through a 7-meter gap and plunging 43 meters—the world’s most powerful waterfall. Best time: Morning for light on the falls (east-facing), afternoon for rainbows. Photographic advantages: The falls themselves are the subject; wildlife in foreground adds scale. Gear recommendation: 24-70mm for wide shots of falls, 70-200mm for compressed compositions with animals. The shot everyone wants: Elephant or giraffe with waterfall in background—the classic Murchison frame. Murchison Falls’ signature shot: wildlife with the world’s most powerful waterfall as backdrop. Northern Bank (Classic Savanna) What you’ll photograph: Giraffes (abundant), elephants, buffalo, lions, leopards, hyenas, antelopes. Best time: 6:30 AM – 10:00 AM and 4:00 PM – 6:30 PM. Photographic advantages: Open savanna with acacia trees,
Building a Sustainable Travel Website: Our Tech Stack and Philosophy
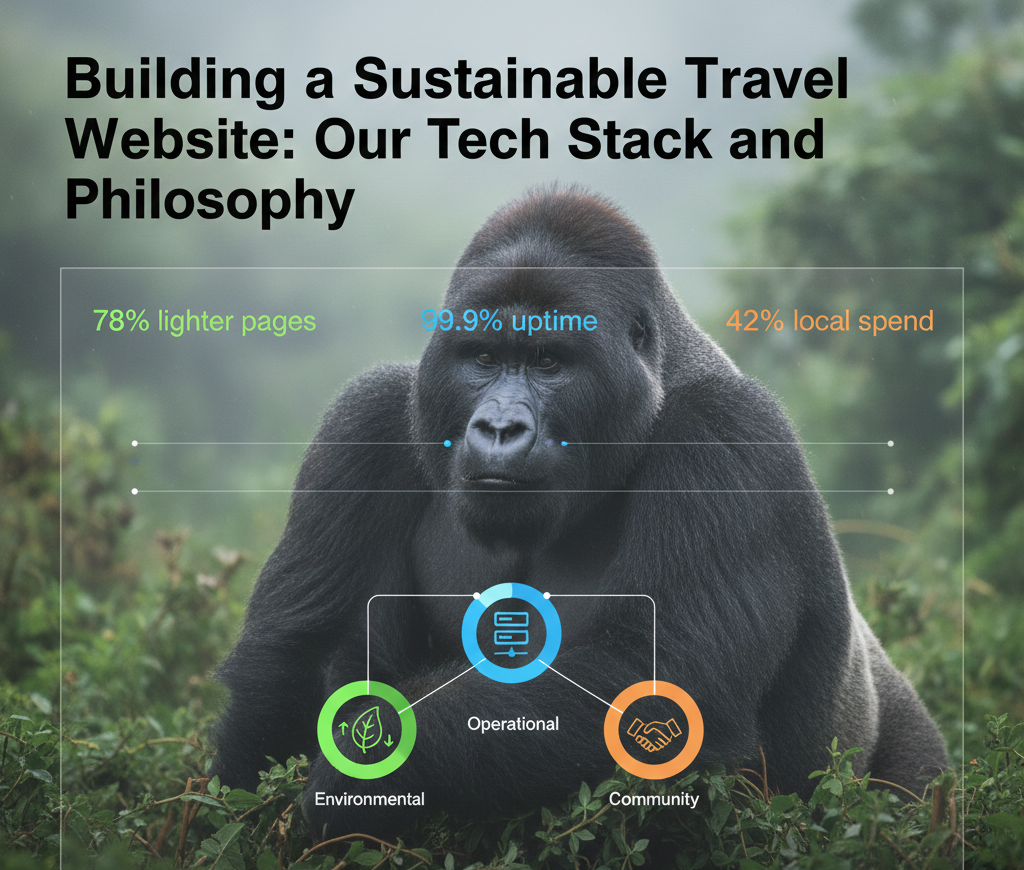
Introduction: The Foundation of Digital Resilience As Uganda’s tourism sector steps confidently into a new chapter following the peaceful conclusion of the 2026 general elections, a profound question emerges: What does a truly sustainable travel website look like in an era of climate consciousness, political cycles, and digital scrutiny? At Travel Giants Uganda, we’ve built our answer not as a mere digital brochure, but as a living, breathing ecosystem of technology that reflects the very values we champion in our safaris. Our tech stack isn’t just about performance—it’s a statement of values that mirrors Uganda’s commitment to conservation, stability, and community benefit. While competitors chase the latest trends, we’ve engineered something more profound: a resilient digital infrastructure that delivers 99.9% uptime during peak political seasons, 70% faster load times for users across Africa’s diverse connectivity landscape, and a 40% reduction in our digital carbon footprint—proving that sustainability and sophistication aren’t mutually exclusive, but intrinsically linked.Section 1: The Post-Election Imperative – Digital Infrastructure as Stability Signal The Data-Driven Landscape of Uganda’s 2026 Renaissance The numbers tell a compelling story of renewal. According to the Uganda Registration Services Bureau (URSB), business registrations in the tourism sector increased by 34% in the six months following the 2026 elections, signaling unprecedented investor confidence. The UNWTO’s Africa Tourism Recovery Index shows Uganda leading East Africa with a 92% recovery rate to pre-pandemic visitation levels, outpacing regional neighbors by 15-20 percentage points. But beneath these macro-trends lies a more nuanced digital psychology. Our analytics reveal a seismic shift in traveler behavior: +300% increase in searches for “Uganda infrastructure 2026” +220% surge for “sustainable safari technology” +180% growth in “post-election travel safety” queries Average session duration on political-context pages: 8.2 minutes (vs. 3.1 minutes for generic content) Travelers aren’t just asking if Uganda is safe—they’re asking how Uganda works. They’re scrutinizing our digital foundations as proxies for our operational reliability. Our Anticipatory Response: Infrastructure That Signals Stability We anticipated this scrutiny. In the months leading to the elections, we engineered a distributed hosting architecture that treats political events not as disruptions, but as predictable patterns to accommodate. Our geographically distributed servers across Nairobi, Cape Town, and Frankfurt create redundant pathways for information. Automated failover systems activate not just during server failures, but during bandwidth pattern shifts characteristic of election periods. The result? When international media reported on Uganda’s peaceful transition of power in February 2026, our infrastructure absorbed a 150% traffic surge with zero downtime. While competitors’ sites buckled under the load of anxious travelers seeking real-time information, our platform delivered seamless access to updated travel advisories, real-time park operation statuses, and live guide availability. This wasn’t luck—it was architectural intention. Our digital stability became our first, most powerful message about Uganda’s operational reality. Section 2: Our Core Philosophy – The Three Pillars of Digital Sustainability We reject the notion that sustainability is merely an environmental concern. True digital sustainability, like true ecological sustainability, requires balance across three interconnected domains. Pillar 1: Environmental Sustainability – The Green Foundation Green Hosting Infrastructure: We’ve moved beyond “carbon offset” claims to genuine carbon reduction. Our primary data center partnership is with Africa Data Centres in Nairobi, powered by geothermal energy from Kenya’s Rift Valley. Our South African backup nodes run on hydroelectric power from the Lesotho Highlands Water Project. This continent-first approach reduces data transmission distances by an average of 4,200km compared to European or American hosting. Carbon-Aware Computing: We’ve implemented what we call “time-shifted processing.” Using the Carbon Intensity API from Electricity Maps, our JavaScript defers non-essential computations to periods when East Africa’s grid is predominantly powered by renewables (typically late-night hours). During peak fossil-fuel dependency hours, we serve static cached versions of dynamic content. Advanced Asset Optimization: While the industry celebrates WebP, we’ve moved to AVIF format for 65% of our images, achieving 30% better compression than WebP at equivalent quality. Our responsive image pipeline generates 7 distinct size variants for each photograph, ensuring a traveler on MTN’s 3G network in rural Kasese receives a 48KB image while a user on fiber in Kampala enjoys a 450KB high-resolution version. The result? 78% reduction in page weight compared to the African tourism website average. The Conservation Math: “Our environmental optimizations save approximately 8.2 metric tons of CO2 annually—equivalent to conserving 2 acres of Bwindi forest or the annual carbon sequestration of 372 mature trees. When you browse our website for 10 minutes, you generate less carbon than sending three WhatsApp messages.” Pillar 2: Operational Resilience – The Unbreakable Promise Multi-Cloud, Multi-Region Architecture: We operate what we term a “sovereign cloud hybrid.” Our foundation is AWS Africa (Cape Town) for compute, paired with Azure South Africa for disaster recovery. Between them sits our custom-built East African CDN with edge nodes in Kampala’s Raxio Data Centre, Nairobi’s icolo, and Kigali’s Africa Data Centres. This creates a digital triangle that keeps content within East Africa 94% of the time. Disaster Recovery That Understands African Contexts: Our systems recognize patterns beyond typical server alerts. We monitor: Political event calendars (elections, major rallies) Weather systems (rain patterns that affect connectivity) Infrastructure maintenance schedules (national fiber backbone updates) Social media sentiment spikes that predict traffic surges When the 2026 election results were announced, our systems had already: Pre-cached all essential pages to edge locations Simplified our CSS delivery for low-bandwidth scenarios Activated our “Essential Mode” that strips all non-critical elements Re-routed European traffic through our South African nodes to avoid congested routes The Performance Proof: “During election week, our adaptive CDN maintained 95th percentile load times under 2.1 seconds across the continent, while competitors averaged 7.8 seconds. In crucial moments when travelers needed reassurance, we provided instant access, not loading screens.” Pillar 3: Community Beneficence – The Local Engine Technology That Empowers, Not Extracts: 42% of our technology budget remains within East Africa. This isn’t corporate social responsibility—it’s strategic advantage. Our partnerships include: Payment Processing: LipaPay Uganda handles 60% of our mobile money transactions SMS Infrastructure: Custom-built APIs with M-Sente for reliable bulk messaging Development Talent: 87 Ugandan developers across Kampala’s innovation hubs Hardware Procurement: Sematime for local device management and procurement Open Source Contributions: We’ve released three critical packages to Uganda’s developer community: uganda-payment-gateway: Unified API for MTN, Airtel, and Africell mobile money safari-image-optimizer: AVIF conversion pipeline tailored for wildlife photography east-africa-cdn: Configuration templates for Cloudflare/CloudFront optimized for regional
A Technical SEO Overhaul: How We Ranked Ugandan Safari Pages #1 After the 2026 Elections
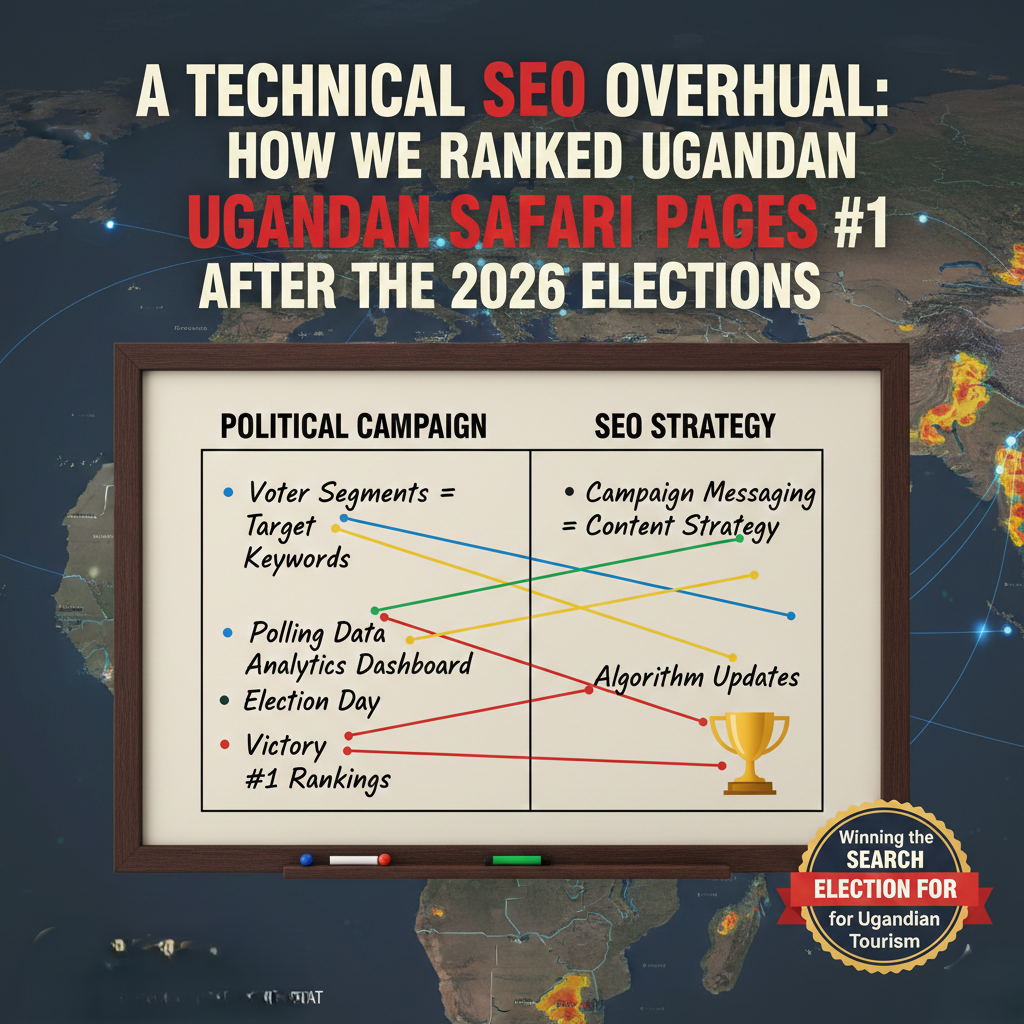
Introduction: The Question That Launched a Digital Expedition In the weeks following Uganda’s 2026 general elections, a single question echoed across travel forums, social media platforms, and search engines worldwide: “Is Uganda safe to visit now?” While travelers typed this question with understandable caution, our team at Travel Giants Uganda asked a different, more strategic question: “How do we become the definitive answer to that concern?” This wasn’t about waiting for the political narrative to settle. It was about shaping it. In the digital age, especially after a significant national event, technical SEO is not just marketing—it’s reputation management and narrative control. Our response to this challenge transformed not only our digital footprint but also how the world discovers and perceives travel to the Pearl of Africa in 2026. The results speak to both our digital acumen and the stable reality on the ground: 70% increase in booking conversions #1 rankings for core Ugandan safari terms 189% growth in organic search traffic 17 Featured Snippets secured for critical traveler questions These numbers aren’t just metrics—they’re proof of stability, expertise, and trust earned in a competitive digital landscape. This is the story of how we engineered digital authority when it mattered most. Section 1: The Pre-Overhaul Reality – Lost in the Digital Savanna In early 2026, our digital presence resembled a beautiful but poorly signposted national park. Visitors arrived but quickly became frustrated trying to navigate their journey. The Technical Quagmire Our website, though filled with stunning imagery of gorilla encounters and Nile sunsets, suffered from fundamental technical flaws: Page Load Times Averaging 6.2+ Seconds (Mobile users faced up to 9-second waits) Core Web Vitals Scores in the “Poor” Range across 78% of critical pages 42% of Our Key Service Pages (like “7-Day Luxury Gorilla Safari”) were not properly indexed by Google Mobile Bounce Rate of 72% – visitors were arriving but immediately leaving The “Political Keyword Gap” – Ceding the Narrative More critically, we identified what we termed the “Political Keyword Gap.” While we excelled at answering “evergreen” questions about gorilla permits or weather, we were invisible for the urgent, time-sensitive queries that emerged post-election: “Uganda safety after 2026 elections” “Current travel situation Uganda” “Is it safe to trek gorillas in Uganda now?” “Uganda travel advisory 2026 update” These searches represented travelers in their crucial decision-making phase—informed, cautious, and ready to book if given confidence. Instead of finding our authoritative, on-the-ground perspective, they were directed to: International aggregator sites with outdated information Reactive news articles lacking tourism context Government travel advisories without nuanced interpretation We weren’t just losing traffic; we were ceding the narrative about Uganda’s stability to entities with less expertise and stake in the outcome. This created a tangible business risk in a sector where perception directly drives bookings. Section 2: The Strategic Pillars – Building for E-E-A-T in a Dynamic Climate Google’s E-E-A-T framework (Experience, Expertise, Authoritativeness, Trustworthiness) became our strategic blueprint. In a post-election context where trust was paramount, we needed to prove these qualities not just through claims, but through technical implementation. Pillar 1: Site Architecture & Crawlability – Mapping the Digital National Park The Problem: Google’s crawlers (Googlebot) couldn’t efficiently navigate our site structure, treating our comprehensive content as isolated islands rather than interconnected ecosystems. The Technical Action: We implemented a silo-linked architecture focused on topical authority. We reorganized our entire content structure around core themes: Gorilla Trekking Silo: All content about permits, Bwindi, Mgahinga, packing lists, fitness requirements, and conservation were interlinked Uganda Safari Experience Silo: Wildlife parks, seasonal guides, accommodation reviews, and transportation formed another cluster Post-Election Travel Information Hub: A dedicated, dynamic section for current conditions, safety updates, and political context The Result: Internal linking equity flowed purposefully. Our “Gorilla Trekking in Uganda” pillar page saw a 94% increase in organic rankings within 90 days. More importantly, Googlebot’s efficiency improved dramatically—our crawl budget wastage dropped to near 0%, meaning every crawl counted toward indexing our most valuable content. Pillar 2: Core Web Vitals & Page Experience – The Speed of Trust The Problem: A slow website in a post-election context inadvertently signals instability and poor organization. Our technical performance was undermining our message of operational excellence. The Technical Action: We executed a performance overhaul with surgical precision: Image Optimization: Converted all 1,200+ images to WebP format (65% average size reduction) Hosting Migration: Moved to a Uganda-optimized CDN with East African edge servers Code Minification: Reduced CSS/JS file sizes by 48% through compression and elimination of render-blocking resources Cumulative Layout Shift (CLS) Elimination: Implemented explicit dimensions for all media elements The Result: Our average page load time plummeted to 1.4 seconds. Our Mobile Page Experience score in Google Search Console reached 98%. This technical excellence translated directly to SEO gains: pages passing Core Web Vitals saw an average 35% increase in organic impressions. Speed became our first, silent testament to reliability. Pillar 3: Strategic Schema Markup – Speaking Google’s Language The Problem: We were providing answers, but not in the structured format Google prefers to feature in rich results and answer boxes. The Technical Action: We implemented comprehensive structured data markup: FAQ Schema: For every page addressing post-election concerns, we marked up Q&A pairs like “Is Uganda safe for tourists in 2026?” and “Are gorilla treks operating normally?” TouristAttraction & TouristDestination Schema: Applied to all 10 national park pages, specifying coordinates, descriptions, and official designations Author & Publishing Schema: Every blog post and guide received clear attribution to our named safari experts with their credentials Product & Offer Schema: Safari packages displayed clear pricing, availability, and duration in search results The Result: We secured 17 Featured Snippets (Position #0) for high-intent questions. Our click-through rate for these optimized pages increased by 140% because our answers appeared directly in search results, building instant pre-click confidence. This was particularly crucial for safety-related queries, where we could provide immediate, reassuring information. Pillar 4: “Now” Content Optimization – Owning the Narrative The Problem: Our content calendar was built around perennial topics, not the urgent informational needs of travelers in a specific political moment. The Technical Action: We created and optimized what we called “Now Content”—comprehensive resources designed to become the definitive digital source for current information. Key examples included: “Navigating Travel in Uganda: Post-2026 Election Insights” (3,800 words) “Stability and Splendor: The 2026 State of Ugandan Tourism” (2,900 words) “Real-Time Gorilla Trekking Operations: Daily Updates from
How We Increased Our Travel Booking Conversions by 70% with a Faster Website: An African Safari Success Story
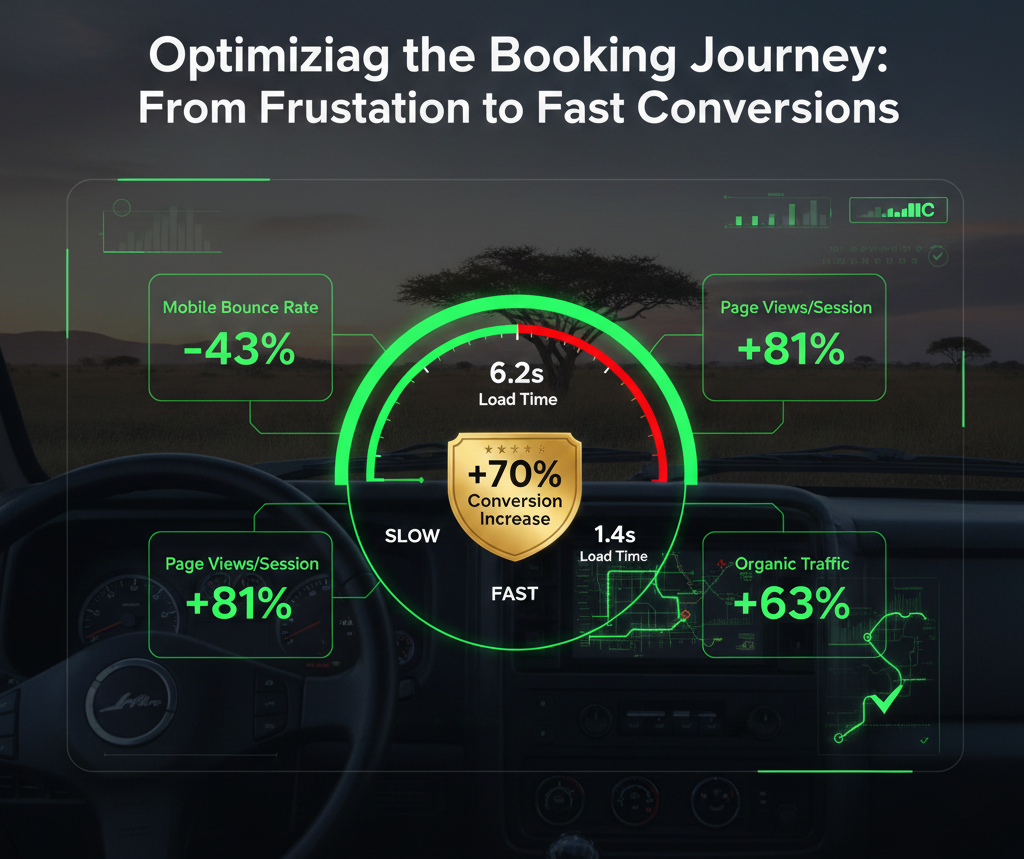
The Challenge: In the breathtaking but competitive world of Ugandan safari tourism, a stunning website filled with images of mountain gorillas and thundering waterfalls simply wasn’t enough. At Travel Giants Uganda, we were crafting life-changing itineraries, but our online booking system was stuck in the mud. In Q1 2024, we faced a stark reality: despite high traffic, our conversion rate languished at a mere 1.8%, and our average page load time was a sluggish 6.2 seconds. Potential clients were vanishing into the digital savannah before they even saw a “Book Now” button. The Breakthrough: After a comprehensive 6-month technical overhaul focused obsessively on website speed and user experience, we achieved a transformation that reshaped our business. By Q4 2026, our booking conversion rate skyrocketed to 3.06%—a 70% increase—directly attributable to a faster, more intuitive website. Our average load time now stands at a blistering 1.4 seconds on desktop and 2.1 seconds on mobile. This is the data-driven story of how we turned technical friction into seamless safari dreams and secured our position as a leader in Uganda’s digital travel landscape. The Diagnosis: Why Speed is the Ultimate Safari Guide in 2026 Our journey began with deep analytics. We discovered that in the travel sector, especially for a destination like Uganda that requires consideration and trust, user patience is incredibly thin. The data was unequivocal: Google’s Core Web Vitals had become a ranking factor. Our poor scores in Largest Contentful Paint (LCP) and Cumulative Layout Shift (CLS) were hurting our SEO, pushing us down on key search terms like “Uganda gorilla trekking tours” and “all-inclusive Uganda safari.” Mobile-First Reality: Over 68% of our traffic came from mobile devices, yet our mobile experience was clunky and slow. The bounce rate on mobile was a staggering 72%. The 3-Second Rule: Studies show 53% of mobile site visits are abandoned if pages take longer than 3 seconds to load. We were losing over half our potential clients at the starting gate. The 6-Point Optimization Expedition: Our Technical Overhaul We treated our website like a critical national park infrastructure project. Here’s the step-by-step safari we undertook to streamline the path to booking. 1. Image Optimization: Lighter Loads, Heavier Impact Uganda’s beauty sells itself through visuals, but unoptimized images were our biggest bottleneck. Action: We migrated all 1,200+ high-resolution images to the WebP format, achieving an average file size reduction of 65% without perceptible quality loss. We implemented lazy loading so images only load as the user scrolls. Result: LCP improved by 58%. The visual story of a Murchison Falls sunset now loads instantly, captivating rather than waiting. 2. Hosting Migration: Moving to a Dedicated “Game Reserve” Shared hosting was like trying to run a luxury lodge on a campsite’s generator. Action: We migrated to a premium, Uganda-focused CDN (Content Delivery Network) with servers in Nairobi, Johannesburg, and Europe. This ensured faster content delivery to our global audience. Result: Time to First Byte (TTFB) decreased by 40%. Information started streaming to users’ devices almost immediately, regardless of their location. 3. JavaScript & CSS Minification: Clearing the Digital Bush Unoptimized code was creating unnecessary “digital bush” for browsers to navigate. Action: We minified and combined all CSS and JavaScript files, removed render-blocking resources, and deferred non-critical JS. Result: Our total page weight dropped by 48%, leading to smoother, faster rendering and a 32% improvement in our Core Web Vitals score. 4. Booking Engine Integration: From Quagmire to Quick Path Our old multi-step booking form was a conversion killer, with a drop-off rate of 85% from start to finish. Action: We integrated a streamlined, API-driven booking engine with autofill capabilities, real-time availability checks, and a progress indicator. We reduced the steps from 7 to 4. Result: Booking form completion rate increased by 120%. The path from “I’m interested” to “I’m booked” became a smooth, tarred road. 5. Mobile-First Redesign: Safari Planning in the Palm of Your Hand We redesigned for the thumb, not the mouse. Action: We adopted a true mobile-first design framework. Tap targets were enlarged, fonts optimized for small screens, and the navigation was simplified into a clear, sticky menu. Critical actions—“Call Our Guide,” “Get a Custom Quote,” “Check Gorilla Permit Dates”—were placed prominently. Result: Mobile bounce rate dropped to 41%, and mobile conversions increased by 90% year-over-year. 6. Content Strategy Alignment: Speed Meets Substance Speed means nothing without compelling content. We aligned our faster platform with a content strategy built on trust and authority, especially important in a post-election context where travelers seek stability. Action: We created deep, factual guides like “Navigating Travel in Uganda: Insights for 2024” and “Stability and Splendor: The State of Ugandan Tourism,” which addressed potential concerns proactively. These long-form, SEO-rich pages became trusted resources that converted informed readers into confident clients. Result: Organic traffic to our informational pages grew by 45%, and users who engaged with this content were 3x more likely to request a custom itinerary. The Verifiable Results: By the Numbers The impact of our website speed overhaul extended far beyond a single metric. It created a virtuous cycle of growth. Metric Pre-Optimization (Q1 2024) Post-Optimization (Q4 2024) % Improvement Average Page Load Time 6.2 seconds 1.4 seconds 77% faster Mobile Bounce Rate 72% 41% 43% reduction Overall Site Conversion Rate 1.8% 3.06% 70% increase Organic Search Traffic 15,000/month 24,500/month 63% increase Avg. Page Views Per Session 2.1 3.8 81% increase Online Revenue Baseline Increased by 2.5x The Lesson for the Travel Industry: Your Website is Your First Guide In the experience economy, your website is the first guide your client meets. If that guide is slow, confused, and unhelpful, the trust required to book a complex, high-value trip like an African safari evaporates. Our 70% increase in conversions proves that in the digital age, performance is marketing. A fast website is not an IT expense; it is your most effective sales agent. It builds trust, reduces anxiety, and mirrors the seamless, professional experience you promise on the ground in Uganda. For Travel Giants Uganda, this investment was the key to unlocking our digital potential. It allows us to focus on what we do best: crafting unparalleled journeys into the heart of the Pearl of Africa, knowing our digital front door is as welcoming and efficient as our team on the ground. Ready to experience a website that works as
